When it comes to executing projects, it often seems like there are as many methodologies are there are managers. One area that is often inconsistent is the focus on collecting, interpreting and acting on data. This applies to data of all kinds; plans, dates, progress, issues, and details of work being done. The most common approach involves mostly subjective decision making, while a smaller but growing number of companies recognize the efficiencies that can be gained from a more disciplined, data-focused approach. Here is an example of that journey at my company's IT highlighting dramatic but achievable results.
In most organizations, it’s very difficult to get a grip on exactly what everyone is doing. Individuals know what their working on, project managers know what they’ve assigned to their people, and resource managers are certain they’ve communicated to their people exactly what they should be doing. Of course, everyone knows exactly how many people are in their company. Why aren’t all of these in harmony?
The value of addressing the situation
Being responsible for IT resource management, I recognized that visualizing the data was critical to enabling management insight. Hundreds of resources worked on well over a hundred projects and visibility into what was really going on was primarily through infrequent communication – usually verbal. With good data, it was clear there were improvements to be gained through more focused decision making. Once senior management could see the current state, improvements were made quickly and in a matter of months we were able to:
- Improve time entry compliance from 75% to over 89% of capacity; and time more accurately reflects project tasks and assignments
- Improve future resource commitments against planed work from less than 65% to virtually 100%
- Improve future commitments from 40% to over 73% of capacity
- Improve future plans from 63% to over 72% of capacity
- Improve past commitments, plans and time entry gaps from over 20% to 8%
The outcome of this process meant:
- Resource dollars being spent were more closely aligned to the strategic direction of the company
- Processes were implemented to formally request and fulfill resource demand including regular reviews of assignments by resource managers
- Resource shortages were clearly visible and had to prove realistic demand in order to get additional resources
- Project resource utilization and resource costs became much better planned; this became the new standard
- Commitments, plans and time entries virtually match which reflects alignment between project managers, resource managers and resources
Before and After
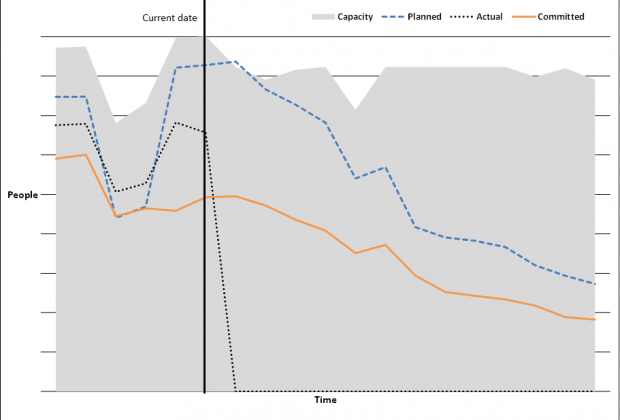
The charts below show before and after we went through refining our project information processes. Since the scales are the same, these show the substantial improvements and efficiency we created. The Current Date bar shows that time sheets are only entered in the past. Plans and commitments show both in the past and the future.
The 1st chart shows what happens when plans and commitments get out of synch. In this case projects are planning on immediate use of large numbers of resources, with sharply declining future need. Glaringly, project managers have planned resources without gaining adequate resource manager commitments for these resources in the future. Capacity remains adequate, so it appears enough resources exist – at least at the aggregate level. As we can see, the actual time spent is greater than the commitments made by resource managers, but fluctuates relative to project plans. Inadequate synchronization between project and resource managers means resources are left to set their own work priorities. Some resources don’t enter time and/or work on “hidden efforts.”
Rolling wave planning is in use, so future planned and committed time show well within capacity – which could falsely give the impression that things will get better soon. If projects timelines change, the divergence of planned/committed to capacity will continue to move forward unless changes are made.
Chart 1 - Before

The 2nd chart shows what can happen when all of these are better aligned. Project resources are committed by resource managers based upon agreed project plans and the capacity of the managers’ group. Time entries reflect that resources are working as committed, although there are still compliance issues. Longer term plans are more realistic, although there is still room for improvement in this area as well.
Chart 2 - After

What does it take?
When project managers and resource managers understand the work that needs to be done and are realistic about who can do the work and when, project execution is greatly enhanced. Data must be collected about plans, commitments and actual time spent in order to understand the problems and make appropriate changes. Next, broader use and acceptance of tools - such as Microsoft Project Server - allow better and more accurate reporting of what is happening with resources in a large enterprise. Finally, a lot of thought and planning must go into how to interpret and present the data.
When project managers and resource managers understand the work that needs to be done and are realistic about who can do the work and when, project execution is greatly enhanced. Data must be collected about plans, commitments and actual time spent in order to understand the problems and make appropriate changes. Next, broader use and acceptance of tools - such as Microsoft Project Server - allow better and more accurate reporting of what is happening with resources in a large enterprise. Finally, a lot of thought and planning must go into how to interpret and present the data.
Explanation of the Chart Information
- Capacity: The number of FTE’s (people adjusted for local holidays, part-time, leaves of absence, administrative time, etc.)
- Planned: A summary of all planned work on projects and departmental efforts
- Actual: Approved time sheet entries for all resources with capacity; historical data
- Committed: The commitments made by resource managers for their resources on projects and department efforts
- People: The measure of resources
- Time: Historical and future data points; separated by the current data